Testing Amazon main images with Manage Your Experiments: design, duration and reading results
Instead of arguing about which main image is better, let the data decide. Brand-registered sellers can run proper A/B tests with Manage Your Experiments. Here's how to design the test, choose a duration, read the result and avoid common misreads.
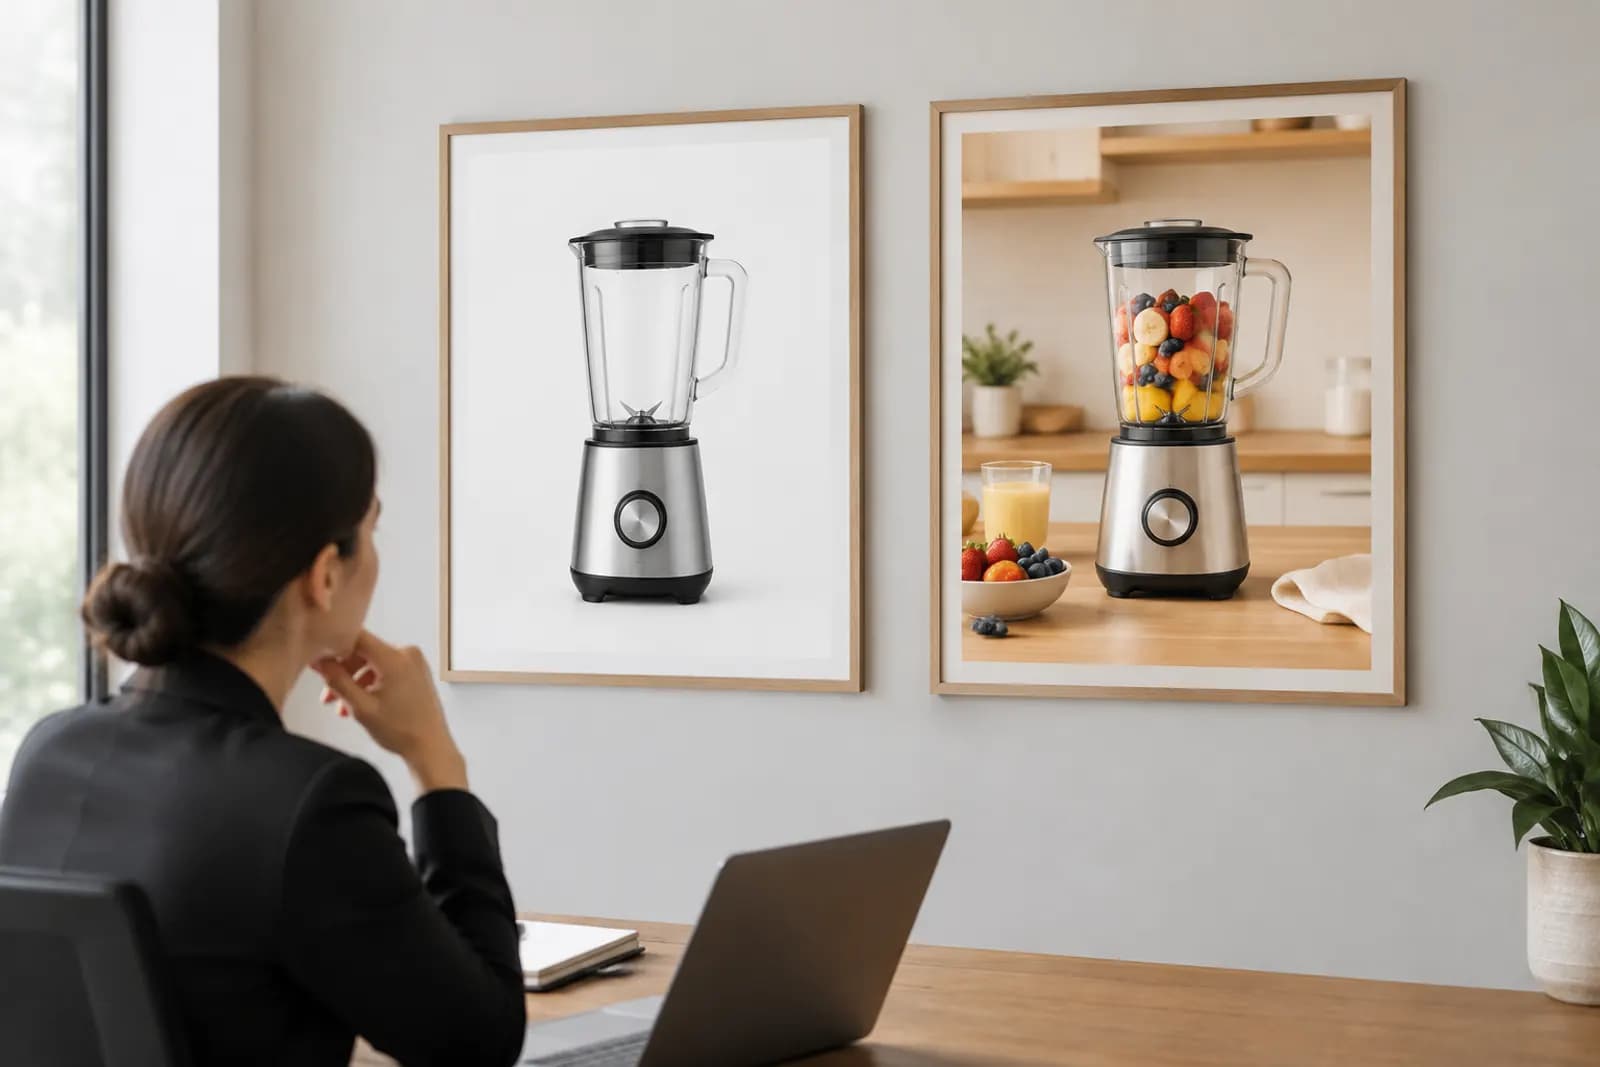
Main image discussions inside a team tend to go the same way. Marketing prefers the one with more atmosphere, the designer prefers the cleaner one, the founder wants "a brighter colour". The final pick often depends on who has the most authority.
Amazon's Manage Your Experiments (MYE) gives brand owners a better option: run two versions live at the same time, randomly split between shoppers, and decide with real sales data.
Check eligibility first
MYE is available to sellers enrolled in Brand Registry, and only ASINs with enough recent traffic qualify. Eligibility is determined by the system; when you create an experiment from the Brands menu, the ASINs you can select are the ones currently eligible. If the product you want to test isn't there, it usually hasn't had enough traffic lately.
You can test main images, titles, A+ content, bullet points and more, depending on the experiment types currently offered. This article covers main images.
Design: two images, one idea
The most common mistake is changing too much at once: different background, angle, arrangement and lighting. Even if version B wins, you won't know why, and you can't apply the lesson to the next product.
Make the two versions differ on a single hypothesis:
| Hypothesis | Version A | Version B |
|---|---|---|
| An angle that shows volume works better | Front | 45° three-quarter |
| Showing accessories lifts clicks | Main unit only | Unit plus included accessories (must ship in the box) |
| A larger product reads better | Product fills 75% | Product fills 90% |
| Showing it open is clearer | Lid closed | Lid open, interior visible |
The main image still has to follow main image rules — pure white, no text — so your levers are angle, framing, fill, product state and what's included.
Duration: somewhere between 4 and 10 weeks
You can choose the experiment length within a range, commonly four to ten weeks. Our guidance:
- High-traffic ASINs: four to six weeks is usually enough;
- Moderate traffic: eight to ten weeks for a fuller sample;
- Avoid major sales. If the test would span Prime Day or Black Friday, event traffic can distort results. Start after the event, or schedule the end before it.
During the test, avoid changing price, making big ad budget shifts or editing other listing content. Randomisation absorbs some of that, but it adds uncertainty.
Reading results: look at the probability
When the experiment ends, Amazon shows how each version performed — units, conversion and other metrics — along with the probability that one version is better and an estimate of impact.
How to read it:
- Low probability means little. If B is better with 55% probability, that's close to a coin flip: the difference isn't changing buyer decisions. Pick whichever is cheaper to maintain.
- High probability is actionable. When the result leans clearly one way (above 90%, say), you can adopt the winner with reasonable confidence.
- Focus on sales per visitor. A main image's job isn't only clicks; it's units per visitor. An image that lifts clicks but not sales has limited long-term value.
- Results have limits. What holds for one product may not hold for similar ones. Re-test on a comparable product before rolling it out.
Ways to fool yourself
Peeking and stopping early. Early data swings wildly; one version often surges ahead and is caught later. Stopping early is a reliable way to pick wrong.
Stocking out mid-test. Neither version sells while you're out of stock, shrinking the useful sample and weakening the result. Confirm inventory before you start.
Big changes in reviews or rating. A wave of negative reviews lowers conversion for both versions equally, but makes any difference harder to detect.
Treating "no significant difference" as "B failed". No difference is a useful finding: this lever isn't what's holding the listing back, so put effort elsewhere — price, reviews, secondary images.
An experiment log
Record every test so the team builds its own body of evidence:
- ASIN and category;
- Hypothesis: we believe changing X will improve Y;
- What differs between A and B;
- Test window, and any sales events, stockouts or price changes;
- Result: winner, probability, key metric changes;
- Conclusion and next step.
After a dozen or so experiments you'll see which levers usually matter in your category and which rarely do.
Preparing the variant
The slow part is making version B: a new angle, or a different fill. If you're short on photography, AI generation can produce candidate white-background versions from different angles based on your product photo, and AI cutout keeps backgrounds pure white. Check every generated image against the real product — shape, colour and details must match exactly.
For applying results across a listing, see how to order your Amazon listing images; for decisions around major sales, see our post-sale image rollback checklist.
Upload one product photo and get a full set of listing-ready visuals in minutes.
Keep reading